How to profile Microblaze application
How to profile Microblaze application
In this brief demo, we shall discuss the steps needed to add profiling to your SDK application running on Microblaze.Hardware and Software:
Table of Contents
Board: KC705
Software: Vivado 2017.4
About GNU profiling:
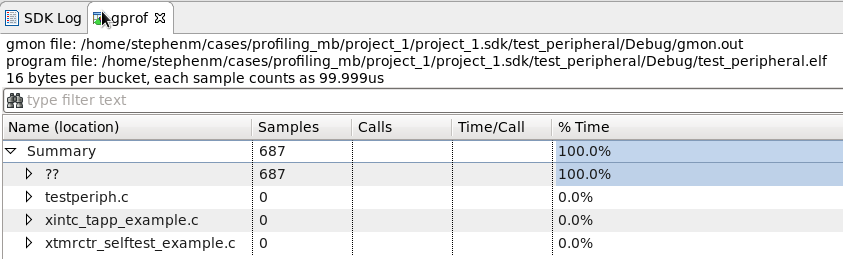
GNU gprof provides two kinds of information that you can use to optimize the program:- A histogram with which you can identify the functions in the program that take up the most execution time
- A call graph that shows what functions called which other functions, and how many times
The program flow is altered in two ways:
- To obtain histogram data, the program is periodically interrupted to obtain a sample of its program counter location. This user-defined interval is
usually measured in milliseconds. The program counter location helps identify which function was being executed at that particular sample.
Taking multiple samples over a long interval of a few seconds helps identify which functions execute for the longest time in the program. - To obtain the call graph information, the compiler annotates every function call to store the caller and callee information in a data structure.

Create the HW application:
The profiling requires a timer interrupt to be added. The system used in this demo can be seen below:

The address map is shown below:

Generate Output Products, Create HDL wrapper, and write Bitstream. Once complete, export to SDK (include bitstream)
Software Creation:
Launch SDK
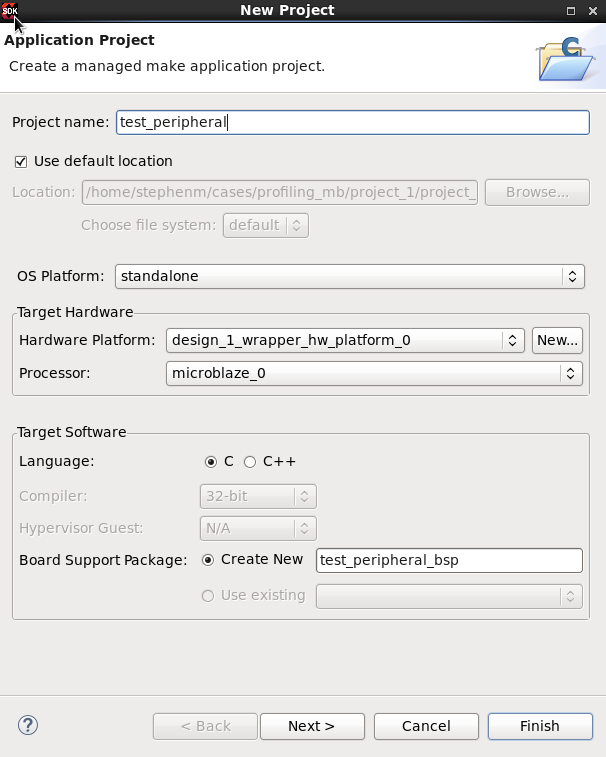
File -> New -> Application Project:

Setting up the software for profiling:
Right click on the BSP, and select Board Support Package settings:
Add the -pg to the extra_compiler_flags:

Set the enable_sw_intrusive_profiling to true, and set the profile_timer to axi_timer_0:

Select OK
Once the BSP is compiled, you will see the file highlighted below:

Here, there is a _profile_timer_hw.c which will register and setup the interrupt handler on the timer:

Right Click on the application and select C/C++ Build Settings:
Enable Profiling:
Ok, then Exit.
Note: Since the profiling uses the interrupt controller. We must update the test peripheral application code, as this will run a timer interrupt test that will conflict with the timer interrupt used by the profiler:

Specifying Profiler Configuration:
To configure options for the Profiler, do the following:
Procedure:
1.In the Project Explorer or C/C++ Projects view, select a project.
2.Select the Run > Run Configuration
3.In the Run Configuration dialog box, select Xilinx C/C++ Application (System Debugger).
4.Create a run configuration.
5.Click the Application tab, select Advanced Options: Edit..
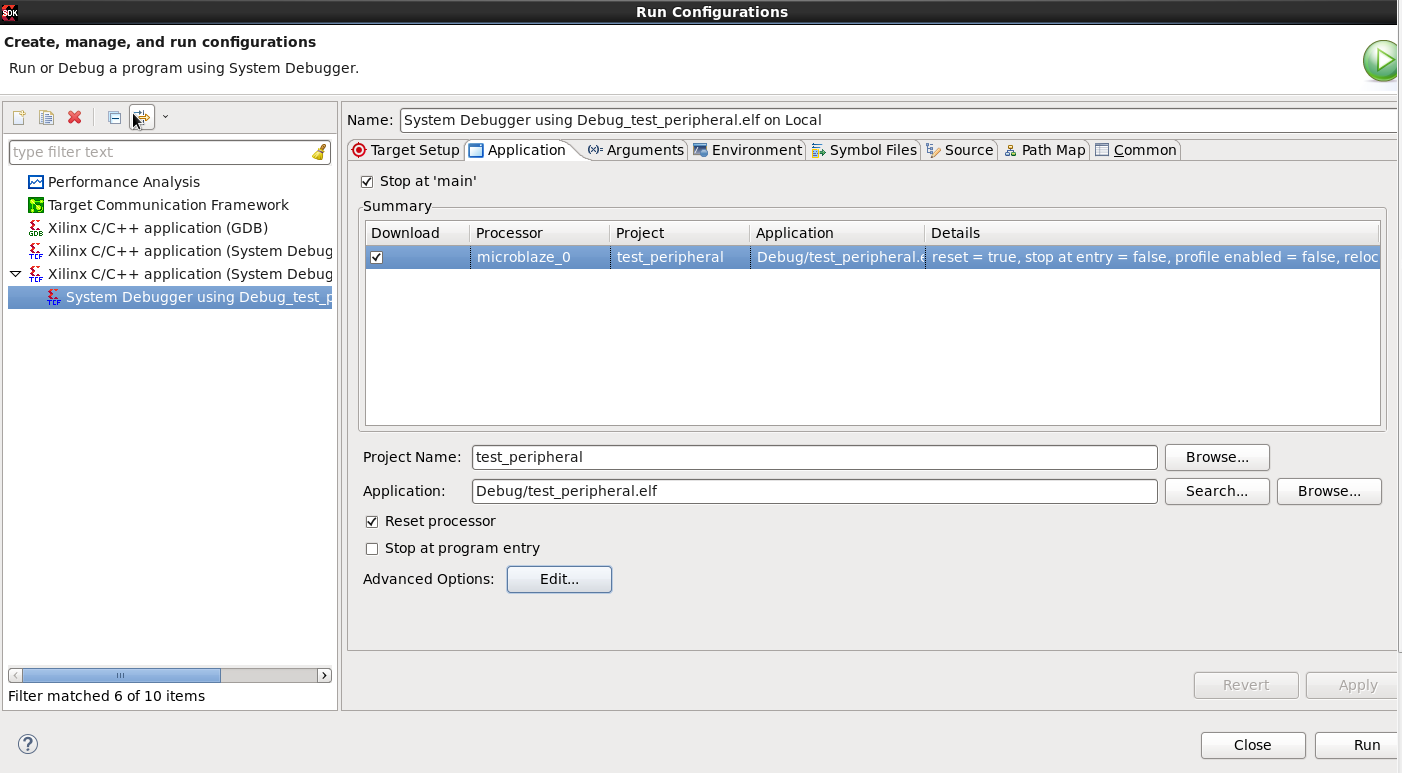
6.In the Profile Options area, click to select the Enable Profiling (gprof) checkbox.
7. Specify the sampling frequency & scratch memory to profile the application, where
a. The sampling frequency is the interrupt interval that the profiling routine uses to periodically check which function is currently being executed.
The routine performs the sampling by examining the program counter at each interrupt.
b. The scratch memory address is the location in AXI BRAM (or DDR) memory that the BSP profiling services use for data collection.
The application program should never touch this space.
8. Click Run to profile the application
Select OK
Viewing the Profiling Results:
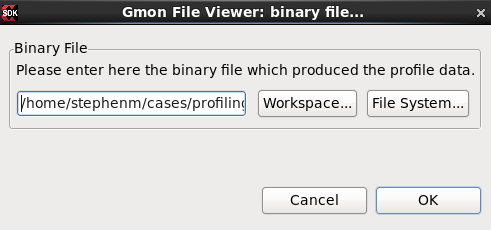
Once the program completes execution (reaches exit), or when you click the Stop button to stop the program, SDK downloads the profile data and stores it in a file named gmon.outSDK automatically opens up the gmon.out file for viewing. The file gmon.out is generated in the Debug folder of the application project.
Related Links
© Copyright 2019 - 2022 Xilinx Inc. Privacy Policy