Debugging Standalone Application on Microblaze using QEMU
from github to do this manually. It is this flow that is discussed here.
Table of Contents
Creating the Hardware
User can create the design using the Vivado IP Integrator tool (see related links). Export to SDK, to create the HDF file.
This HDF file is to be used to create the devicetree that is used in QEMU
Creating the devicetree
Xilinx provide a devicetree generator (DTG) to create devicetree from a HDF file
Below is a quick example of generating and compiling devicetree sources for MicroBlaze. For more comprehensive details see Build Device Tree Blob.
Download the devicetree generator (DTG)
- mkdir repo/my_dt
- cd repo/my_dt
- git clone https://github.com/Xilinx/device-tree-xlnx
- cd device-tree-xlnx
- git checkout xilinx-v2017.1
Note: Make sure that these is a memory node added to the pl.dtsi. This may not be added by the DTG.
If not, users can add this as shown below:
 lmb_bram: memory@0 {
                device_type = "memory";
                reg = < 0x0 0x10000000 >;
 } ;
Then update the Microblaze node with this:
memory = <&lmb_bram>;
Also, the Microblaze Node should be updated to change the model and version:
model = "microblaze,8.40.b";
version = "8.40.b";
Create the DTS
- launch HSI, source the TCL file below and run the command gen_dtb <HDF FILE>.hdf
proc gen_dtb {hdf} {
   open_hw_design $hdf
   set_repo_path ./repo
   create_sw_design device-tree -os device_tree -proc microblaze_0
   generate_target -dir my_dts
}
- Exit HSI
Download devicetree compiler (DTC)
- git clone https://git.kernel.org/pub/scm/utils/dtc/dtc.git
- cd dtc
- make
- export PATH=$PATH:/<path to dtc>/dtc
- make sure that you can call the dtc -help
Create the DTB
- dtc -I dts -O dtb -o my_dts/system-top.dtb my_dts/system-top.dts
Launching QEMU
qemu-system-microblazeel -M microblaze-fdt-plnx -m 256 -serial mon:stdio -device loader,file=mb_bootloop_le.elf -gdb tcp::1137 -hw-dtb my_dts/system-top.dtb -display none
Note: Here users can ether pass the bootloop elf, or the actual executable that they want to test.
Launching debugger and connecting to QEMU
Currently, the XSDB debugger does not support the Microblaze via QEMU. Users, can use the GDB debugger.
Users can connect to the debugger using the target remote: <port> command
Since the Microblaze is configured to use Little Endian (this is hard-coded in the Microblaze config), then we must tell the debugger this.
Load the ELF, and symbol info and then user is ready to debug.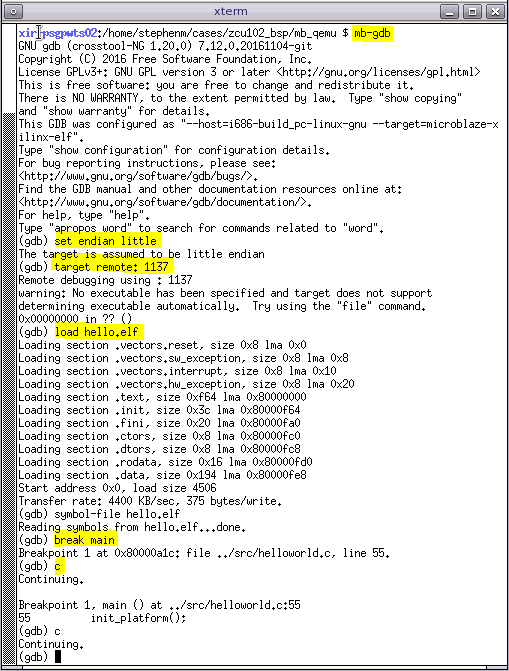
Here, we can see the output on the serial port: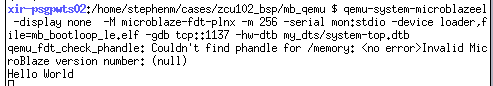
Type Ctrl A + x to terminate the QEMU
Related Links
- Vivado Embedded Processor Hardware Guide here
- Xilinx QEMU User Guide here
- ZCU102 OSL Flow here
- Build Device Tree Blob
- /wiki/spaces/XWA/pages/18842192
© Copyright 2019 - 2022 Xilinx Inc. Privacy Policy